First, go to your active survey table.
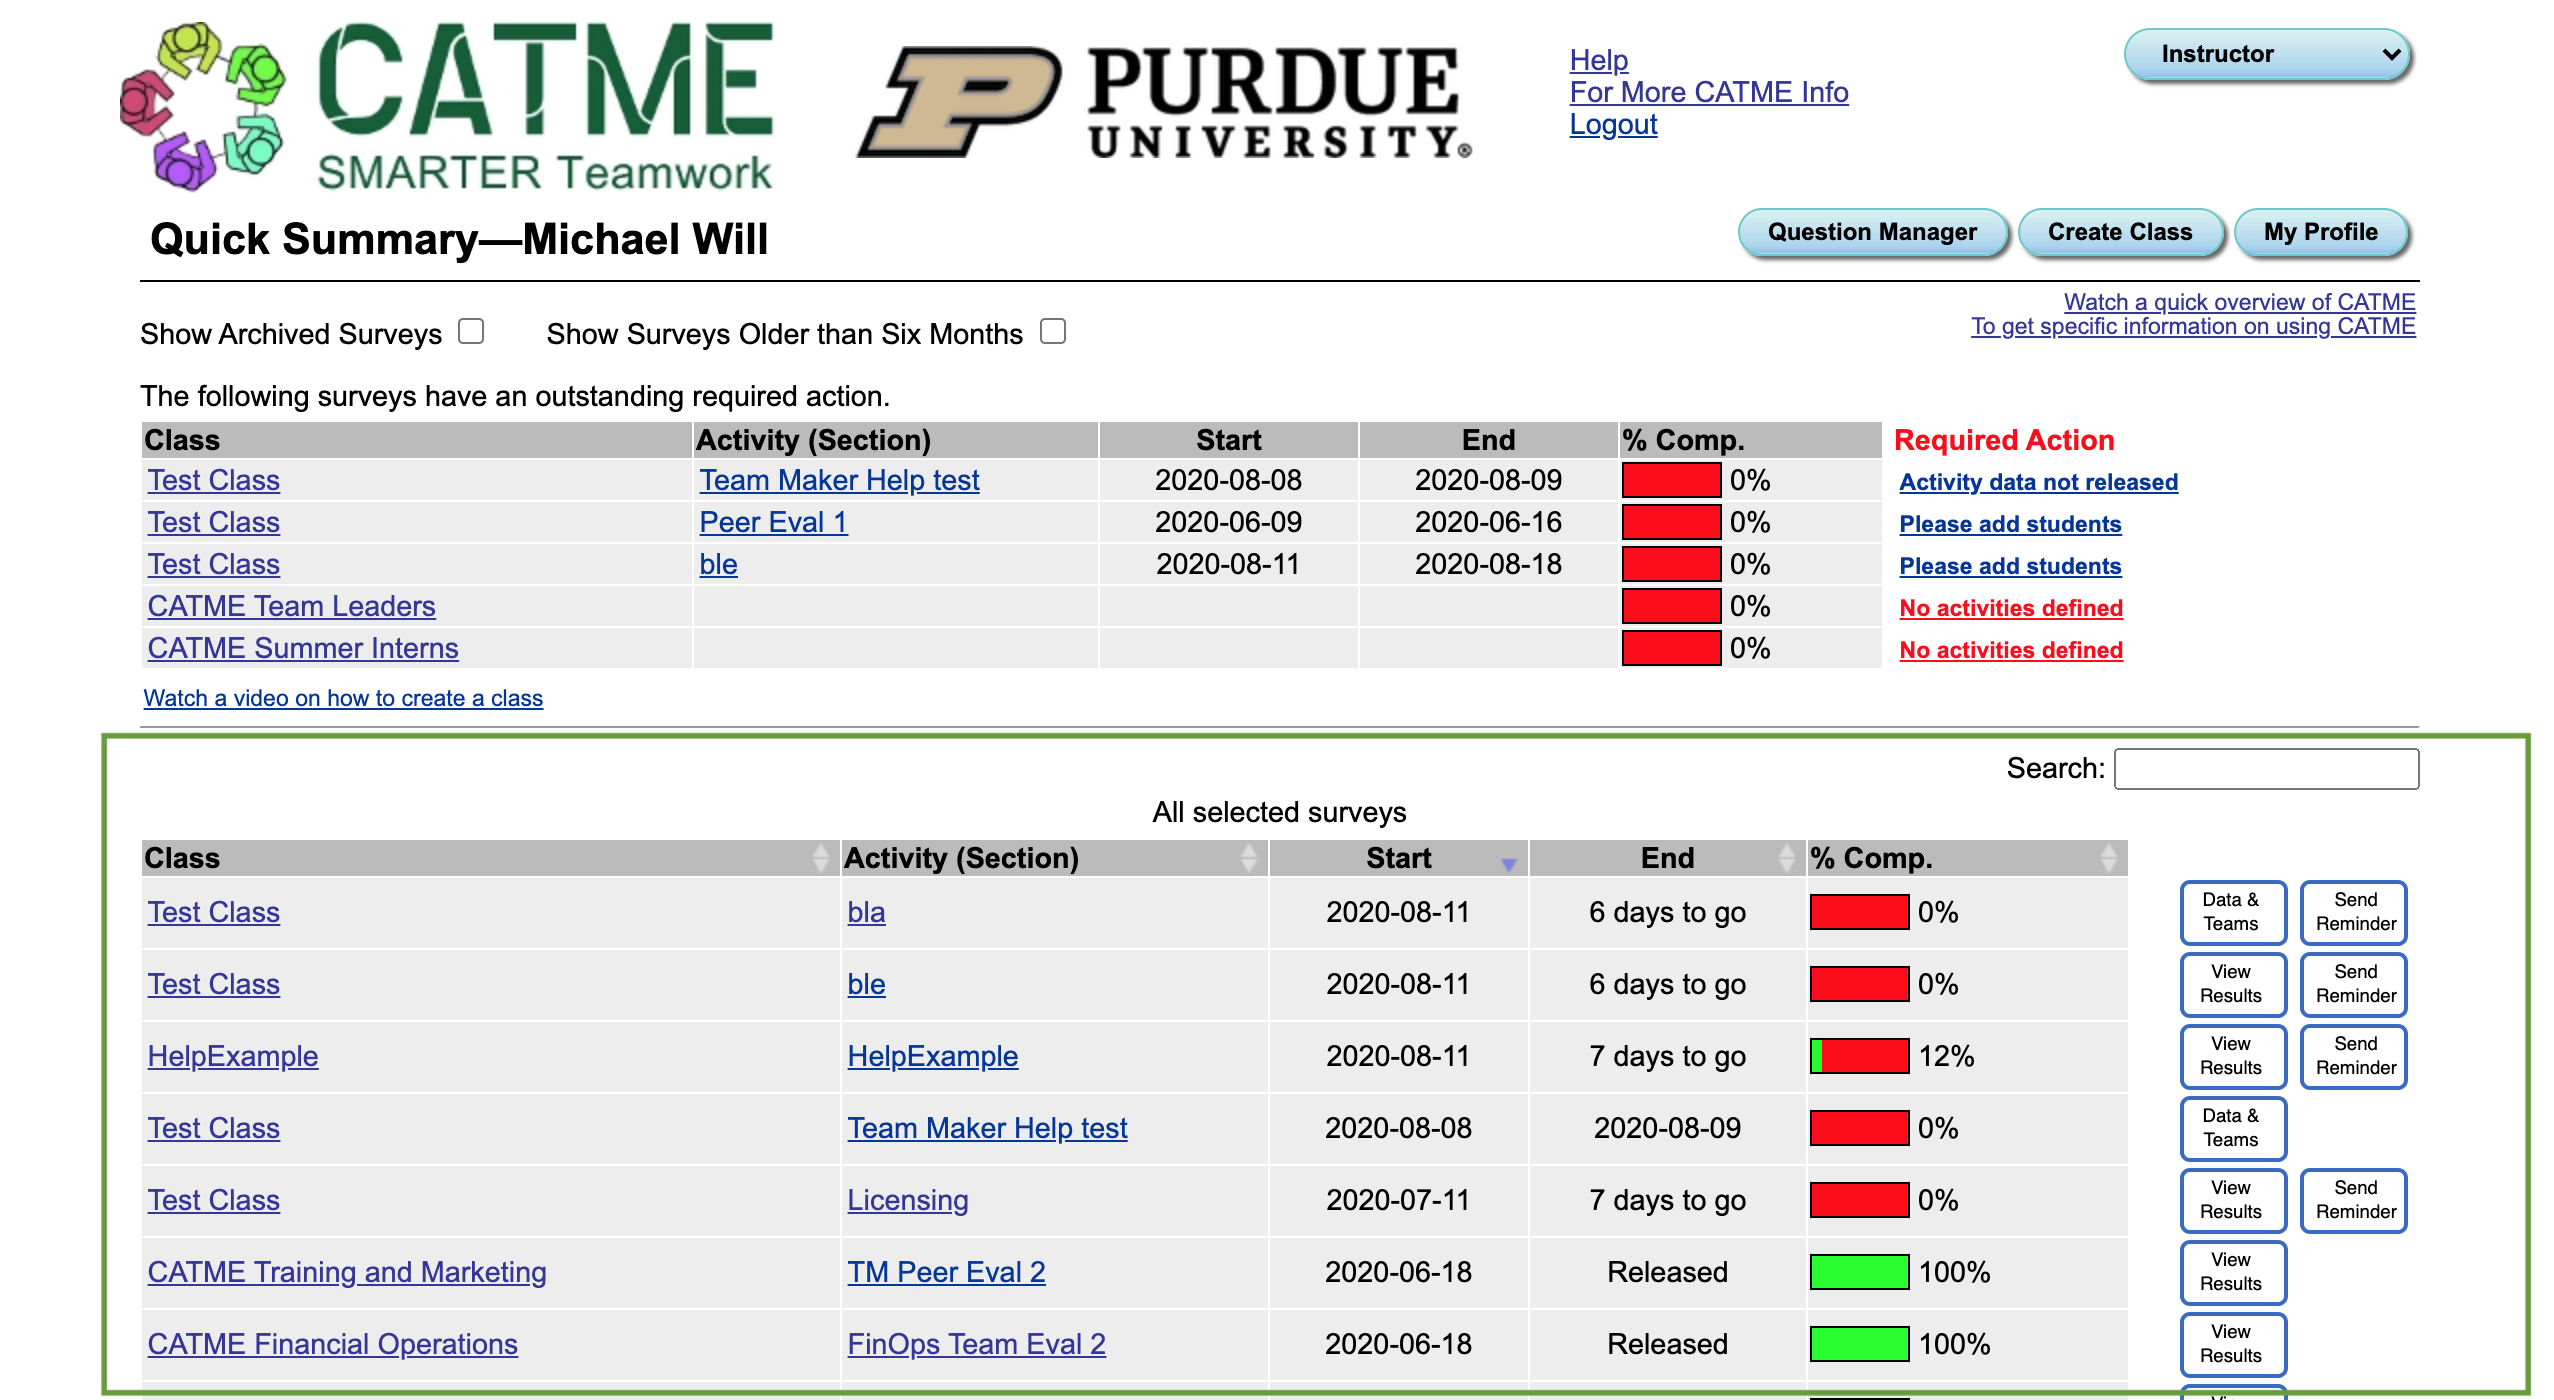
Find the survey you want to access the data for and click "View Results."

This will take you to the Activity Results screen. This screen shows all the data collected by the Peer Evaluation survey.
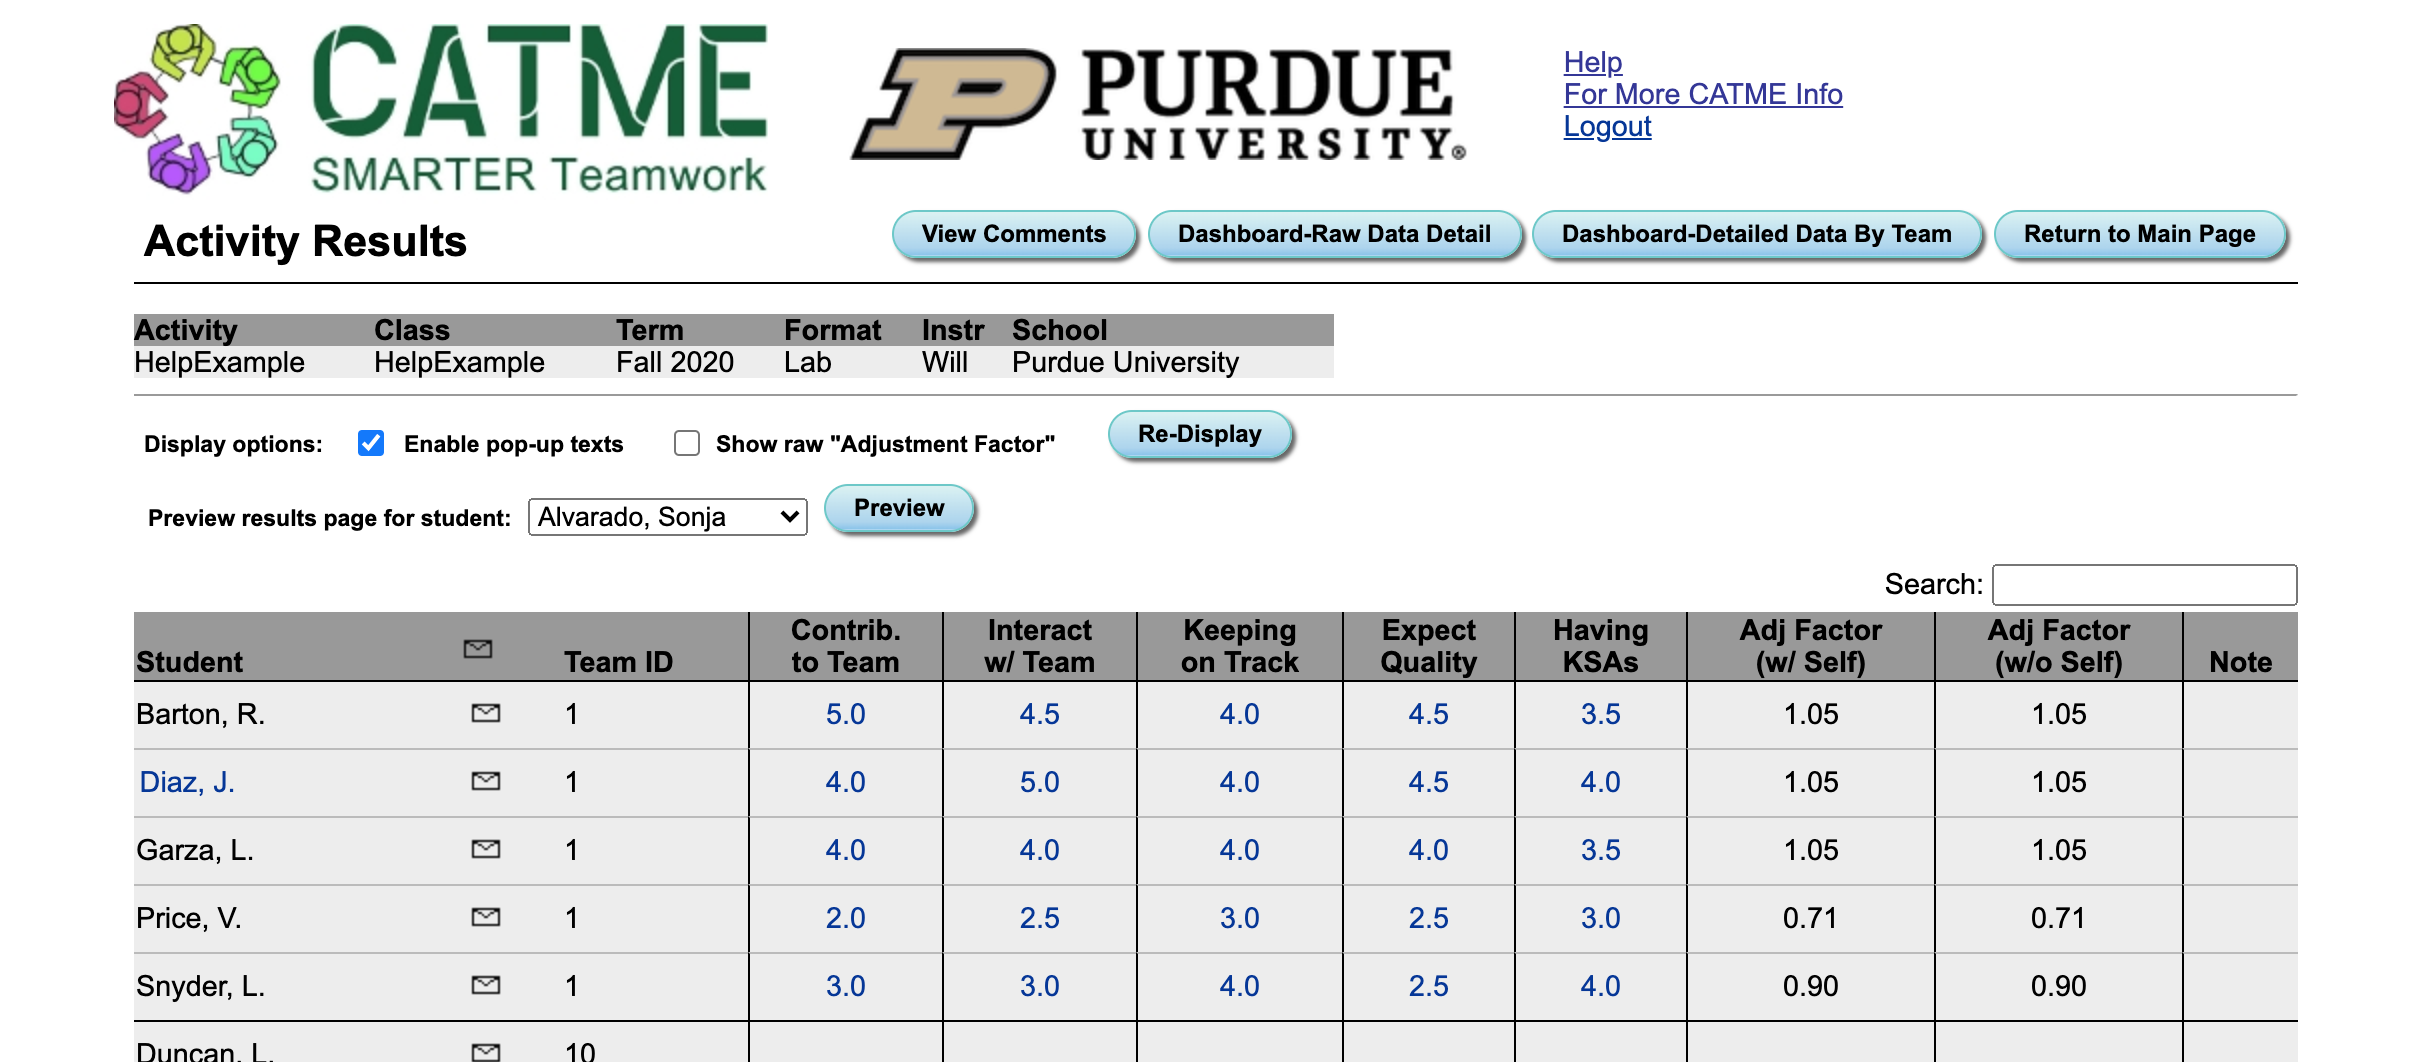
The results table displays the average of the scores each student has received from their peers and themselves for each question as well as adjustment factors that you can use to more accurately understand the results. For more information on adjustment factors, please view the Adjustment Factors video, or visit our help section on them. The last column "Note" displays exceptional conditions if there are any.

Enabling Pop-up texts will allow you to see information when hovering over things. Pop-up texts can be turned on by selecting "Enable pop-up texts" in the top right corner and clicking "Re-Display."

When Pop-up texts are enabled, hovering over a student's name will show any comments they have made to you.

Hovering over a score will display the comments of the students who have filled that are directed to the person whose score you are hovering over.

While you can view Peer-to-Peer comments using pop-up texts, a more effective way of reading comments your students have made is through the "Activity Comments" page. To access this page, click the "View Comments" button on the top right corner of the Activity Results screen.

Displayed below is the Activity Comments page.
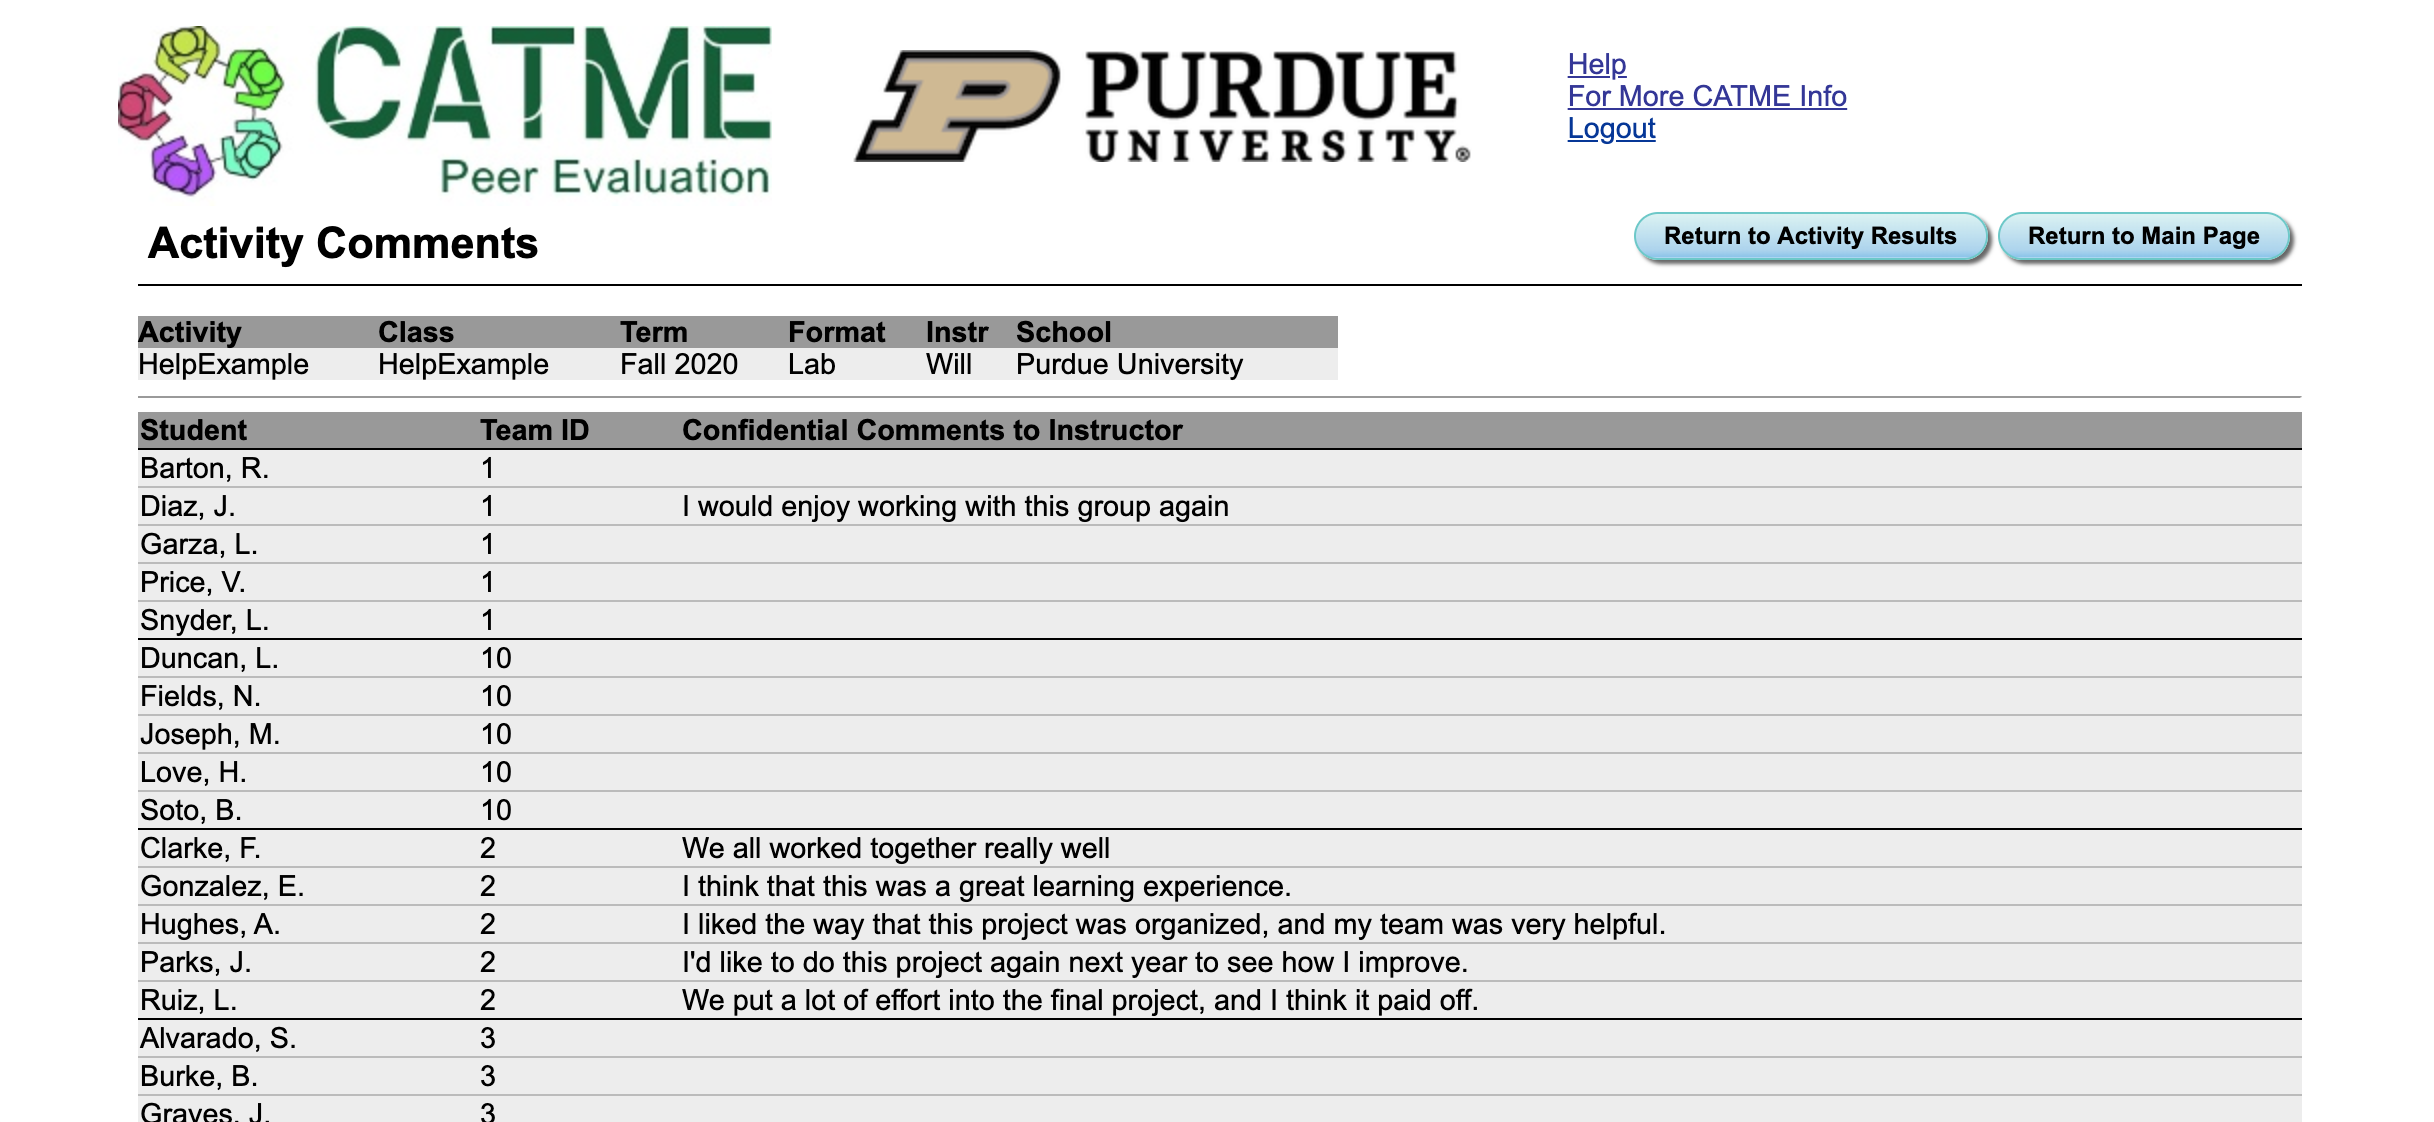
This page has two main sections:

This table displays all the comments created by students that are directed at you, the instructor. This table will update as students fill out your survey.
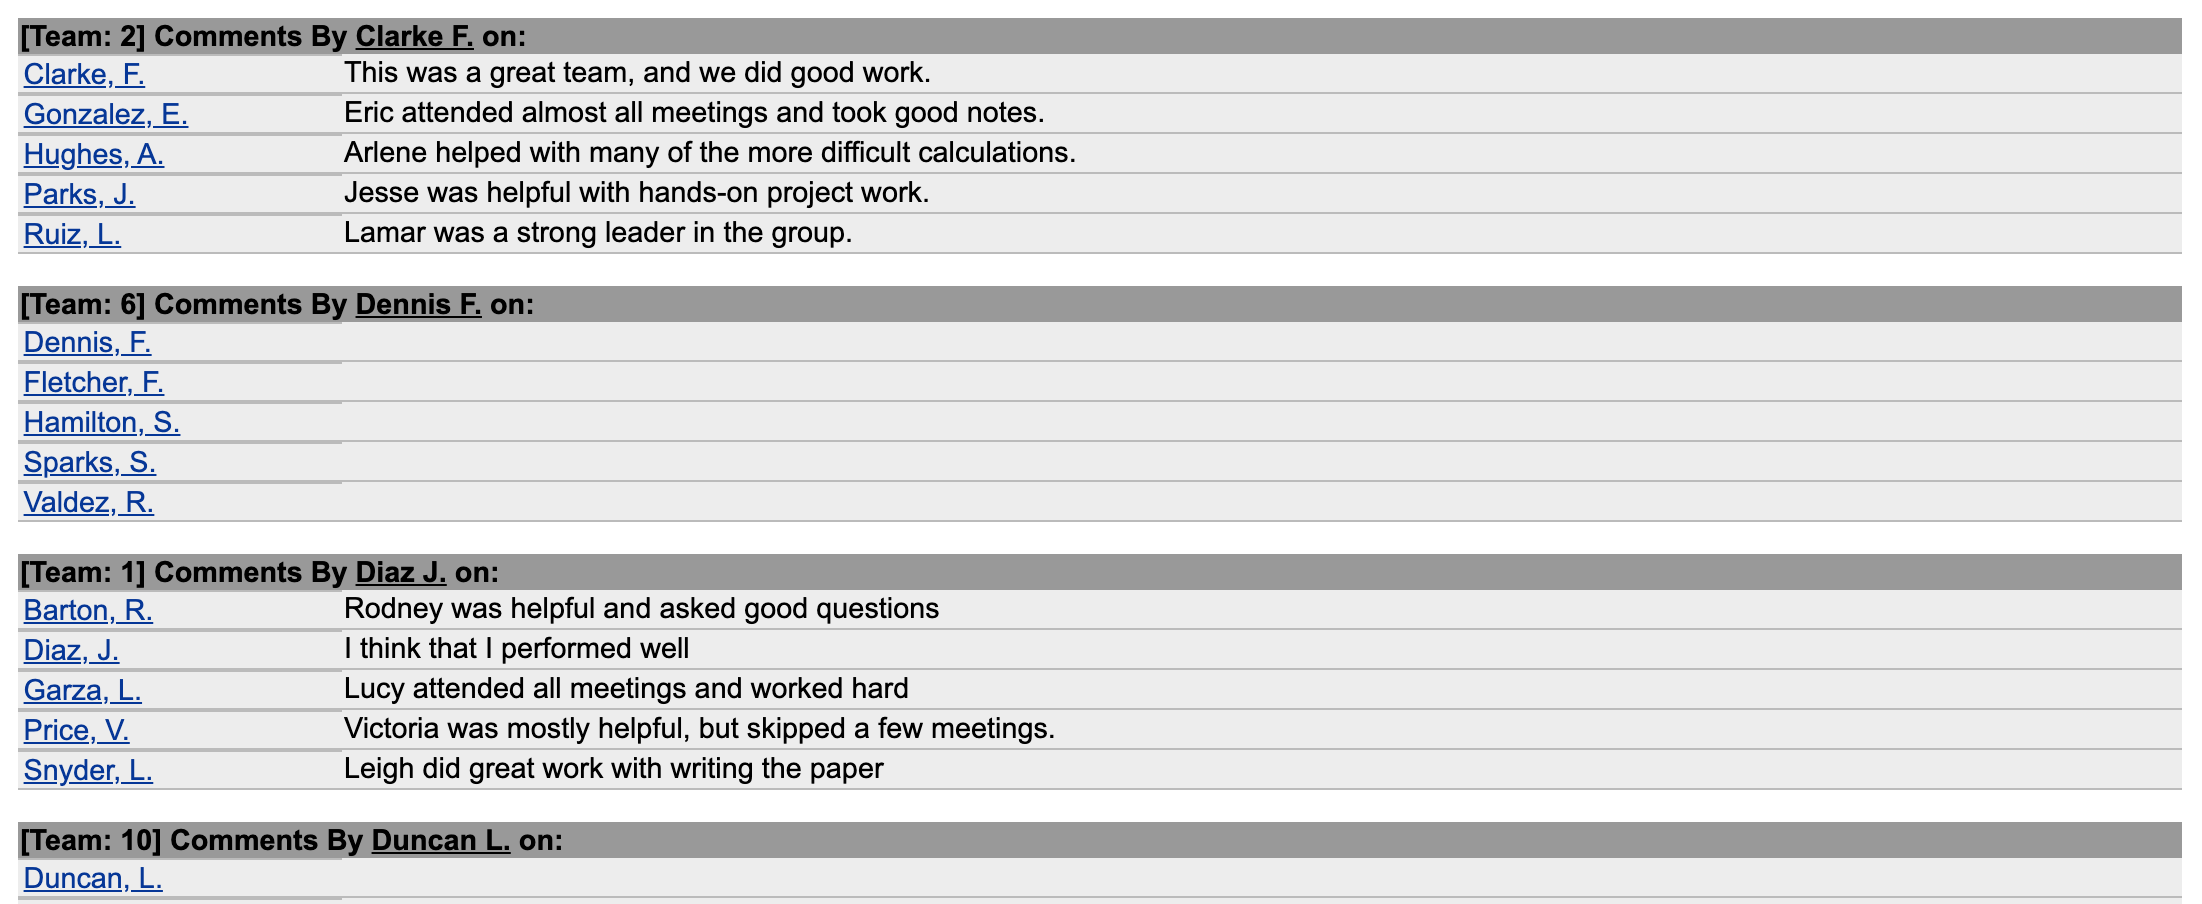
This section contains the comments your students have made about each other. Each student's comments are displayed as separate tables. For example, Judith Diaz's comments about herself and her teammate are displayed in the table below.

These tables are organized alphabetically by the student's last name. This section will update as your students fill out your Peer Evaluation survey.
CATME allows you to view all the data for all of your students on one dashboard. To access this dashboard, click on the "Dashboard-Raw Data Detail" button on the top-right corner of your Activity Results screen.

This will bring you to the Raw Data Detail page. This page shows what each team member rated each other, adjustment factors, rater practice results, and Peer-to-Peer comments.
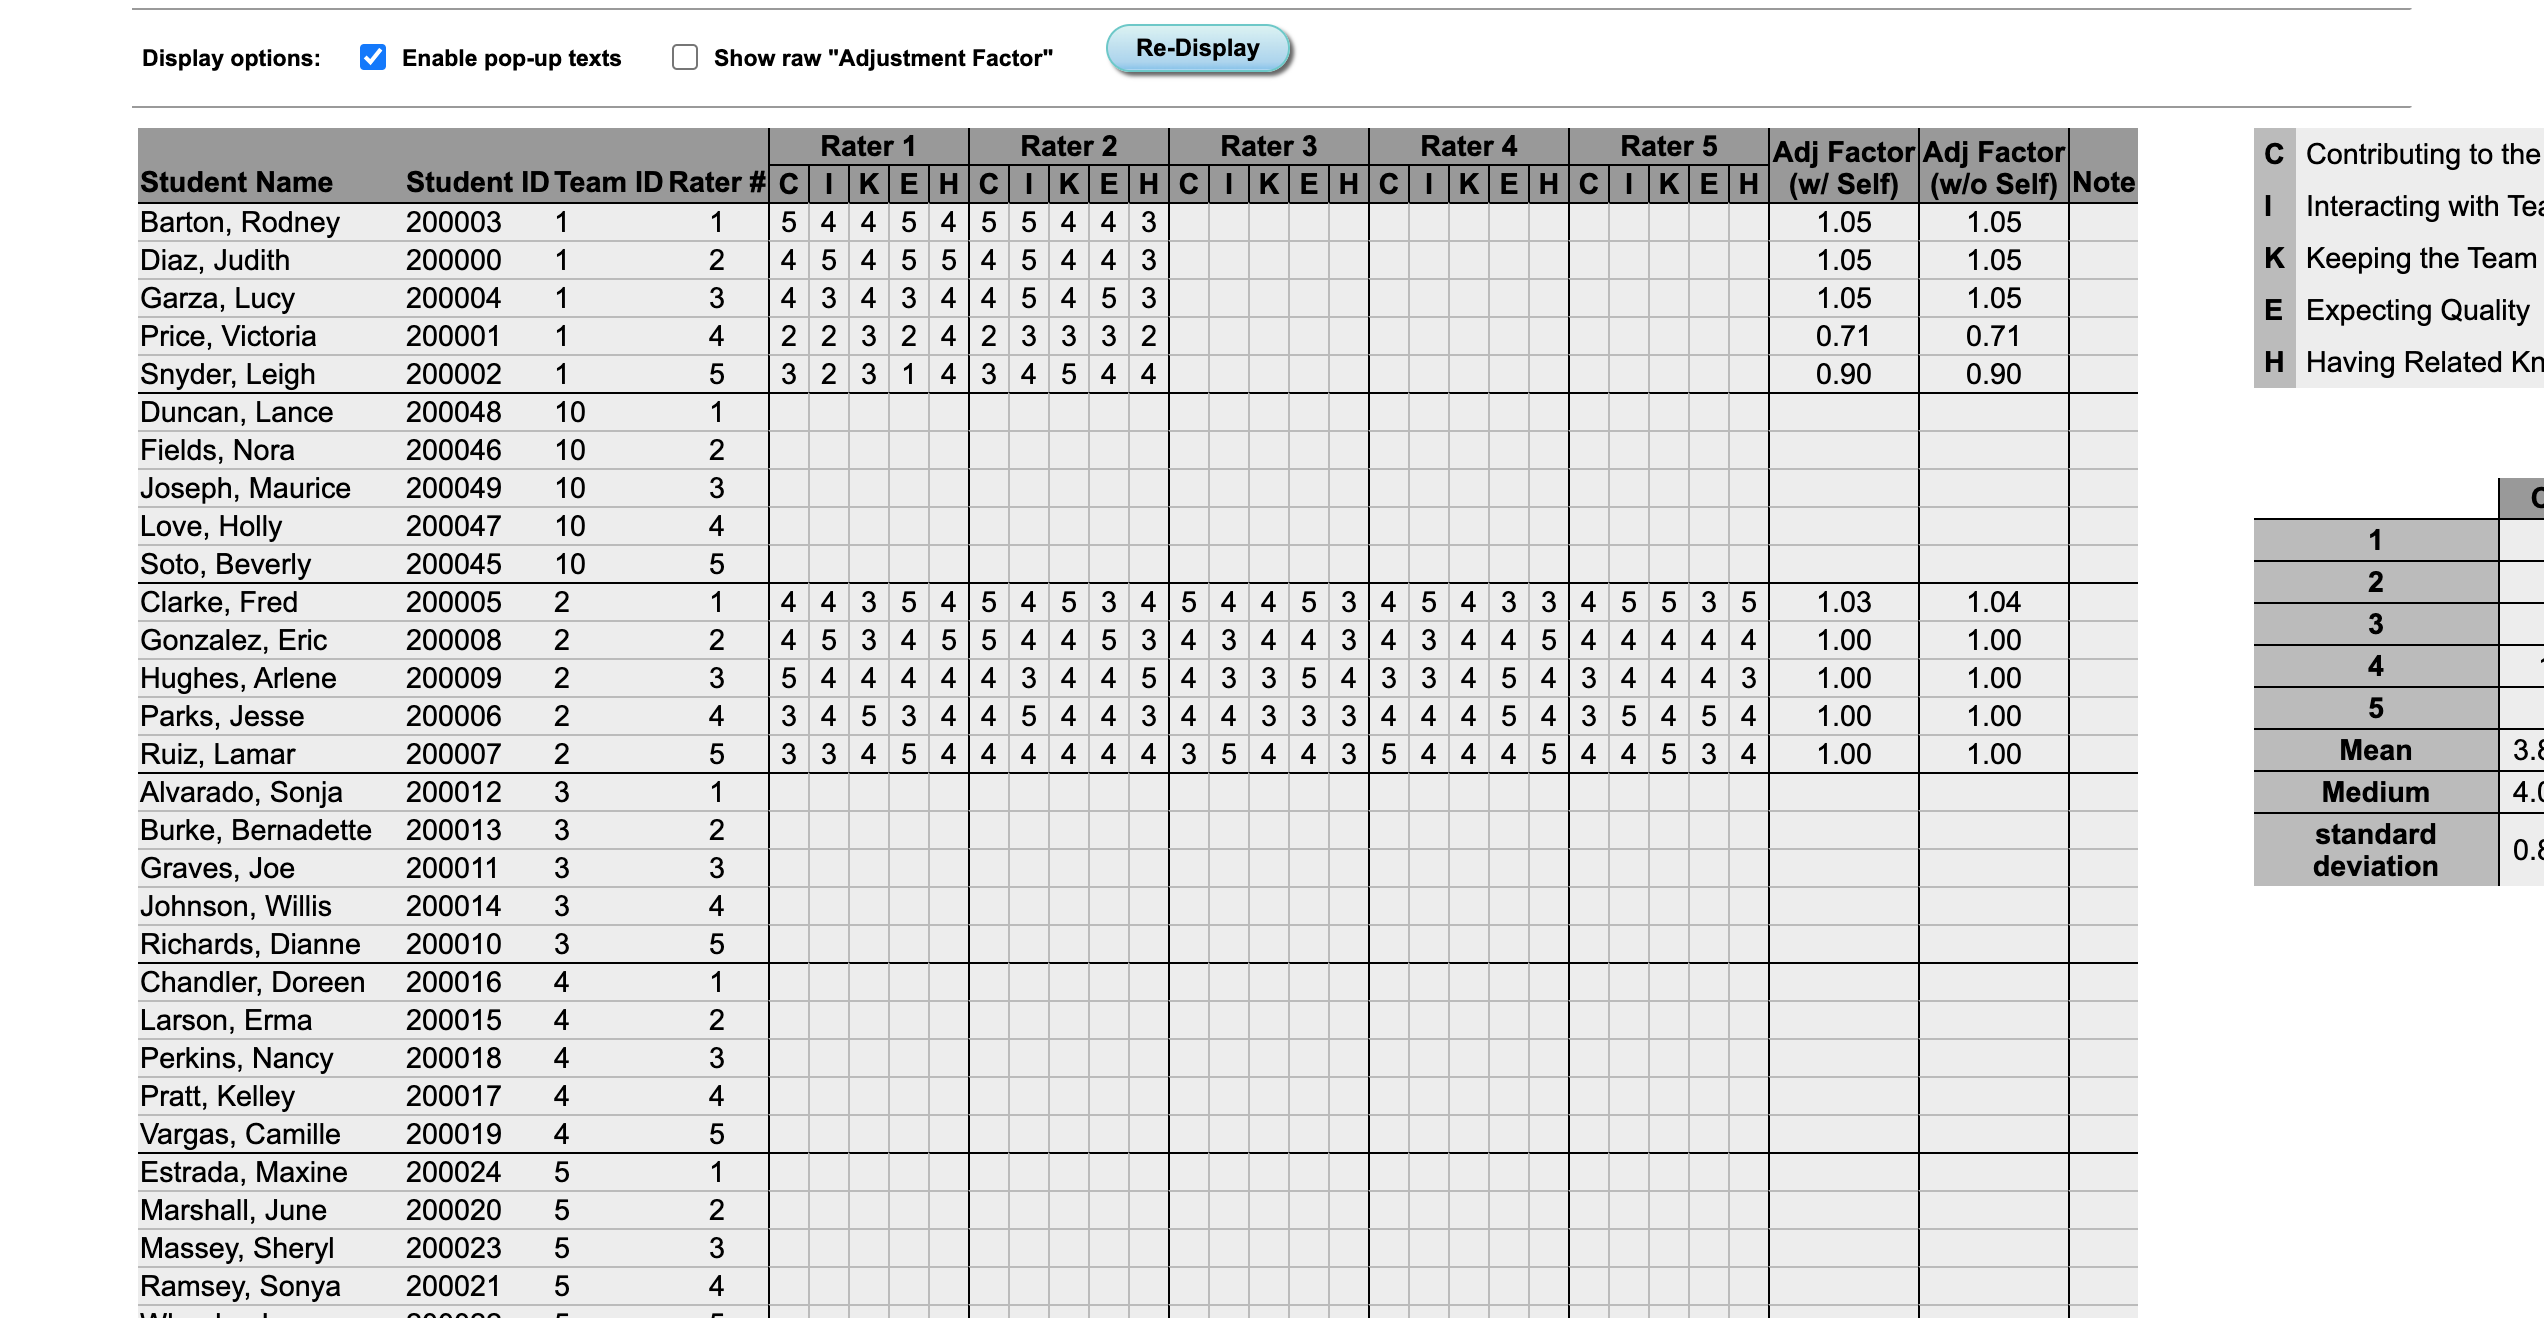
To export your data as a Comma Separated Value file that can be viewed in different spreadsheet editors, click the "Export to CSV" located in the top right corner of the page.
For more information, please view our video on Raw Data Reports.
To view a dashboard report of data for a specific team, click "Dashboard-Detailed Data By Team."

This will take you to the page below where you can select what team you are working with and what data you want to view.
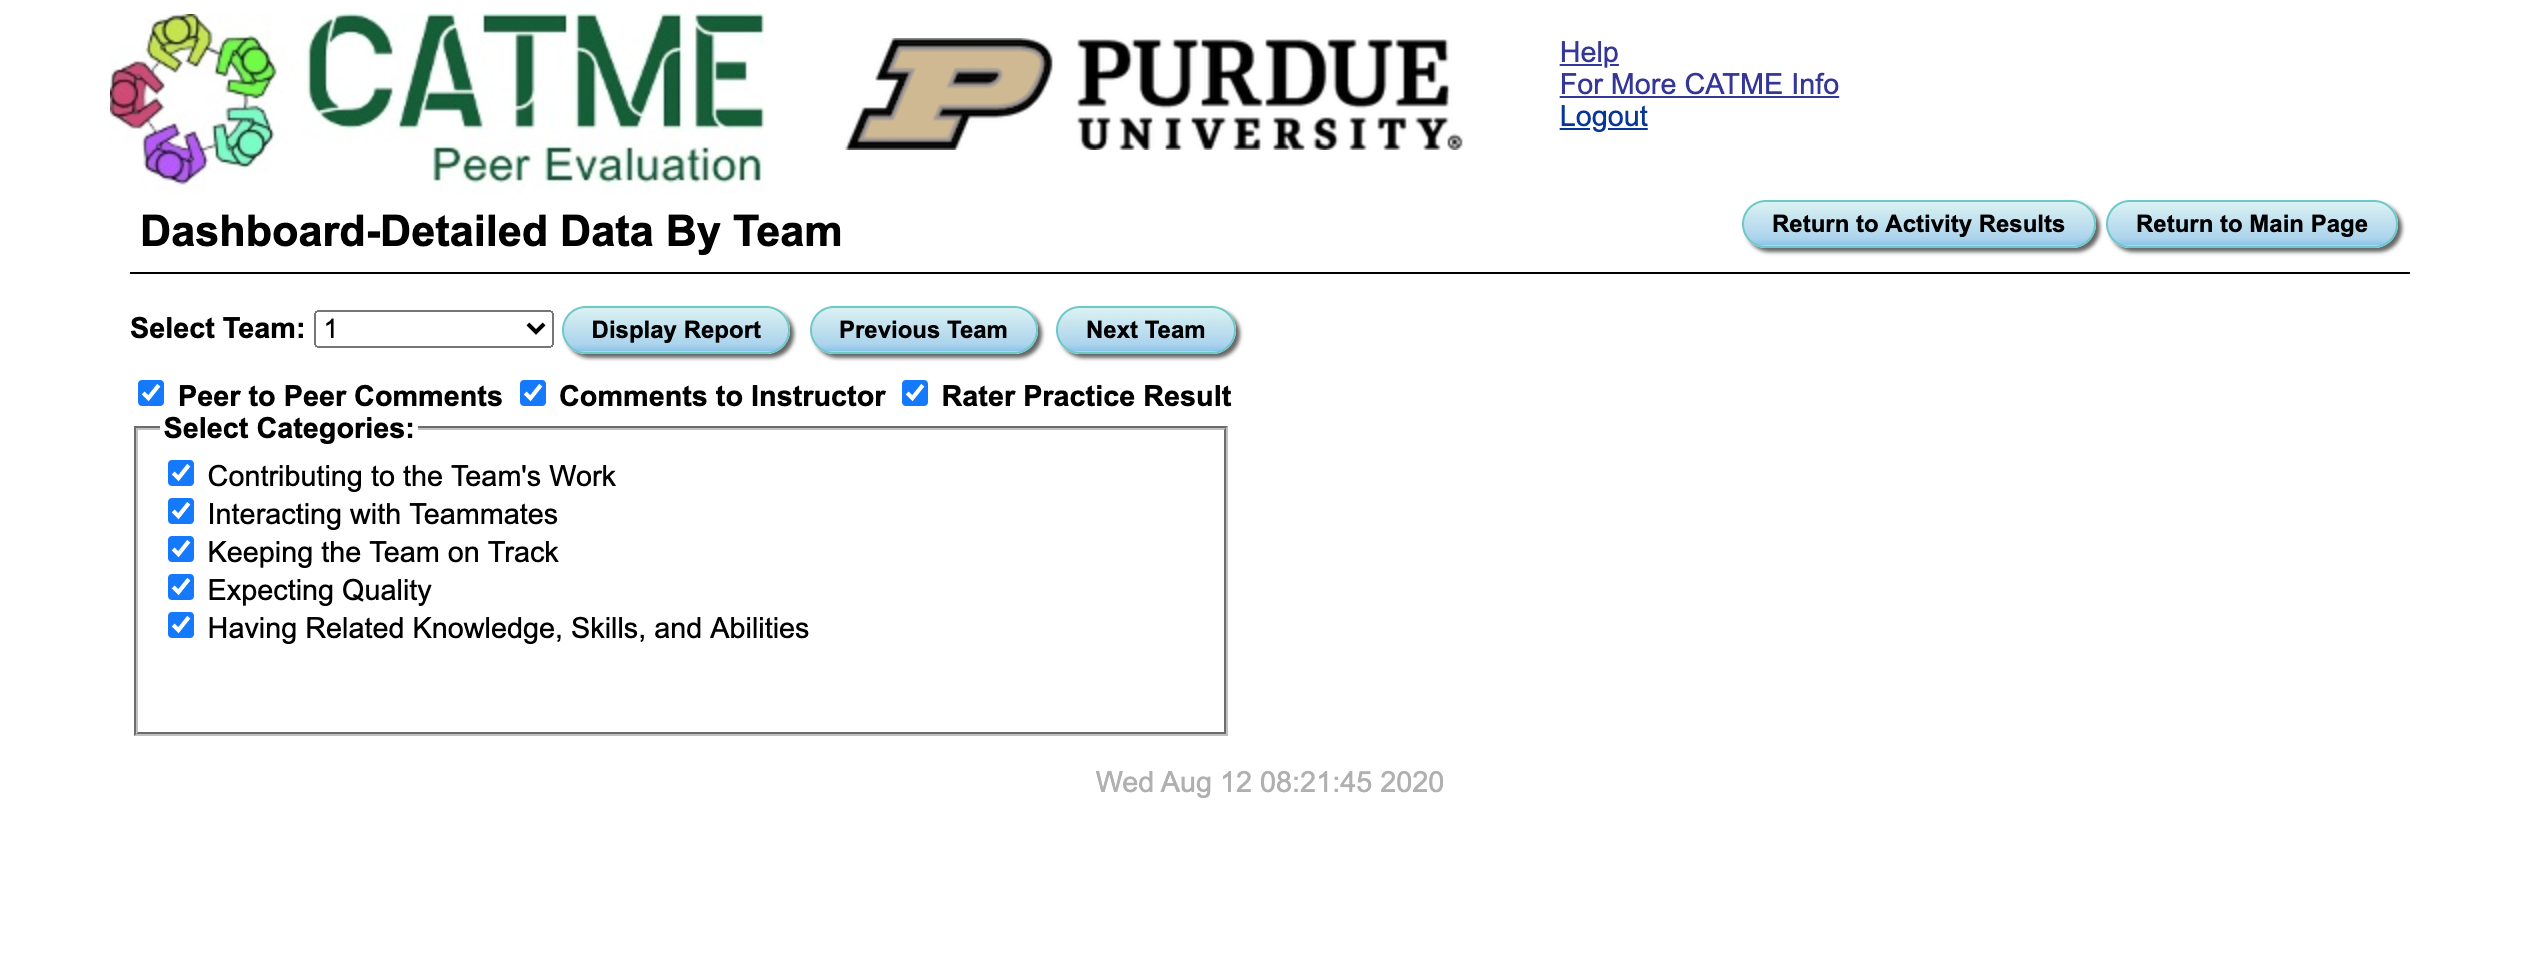
Once you are done with your selection, click "Display Report." This will bring up a dashboard report for the team you have chosen with all the data you asked for.
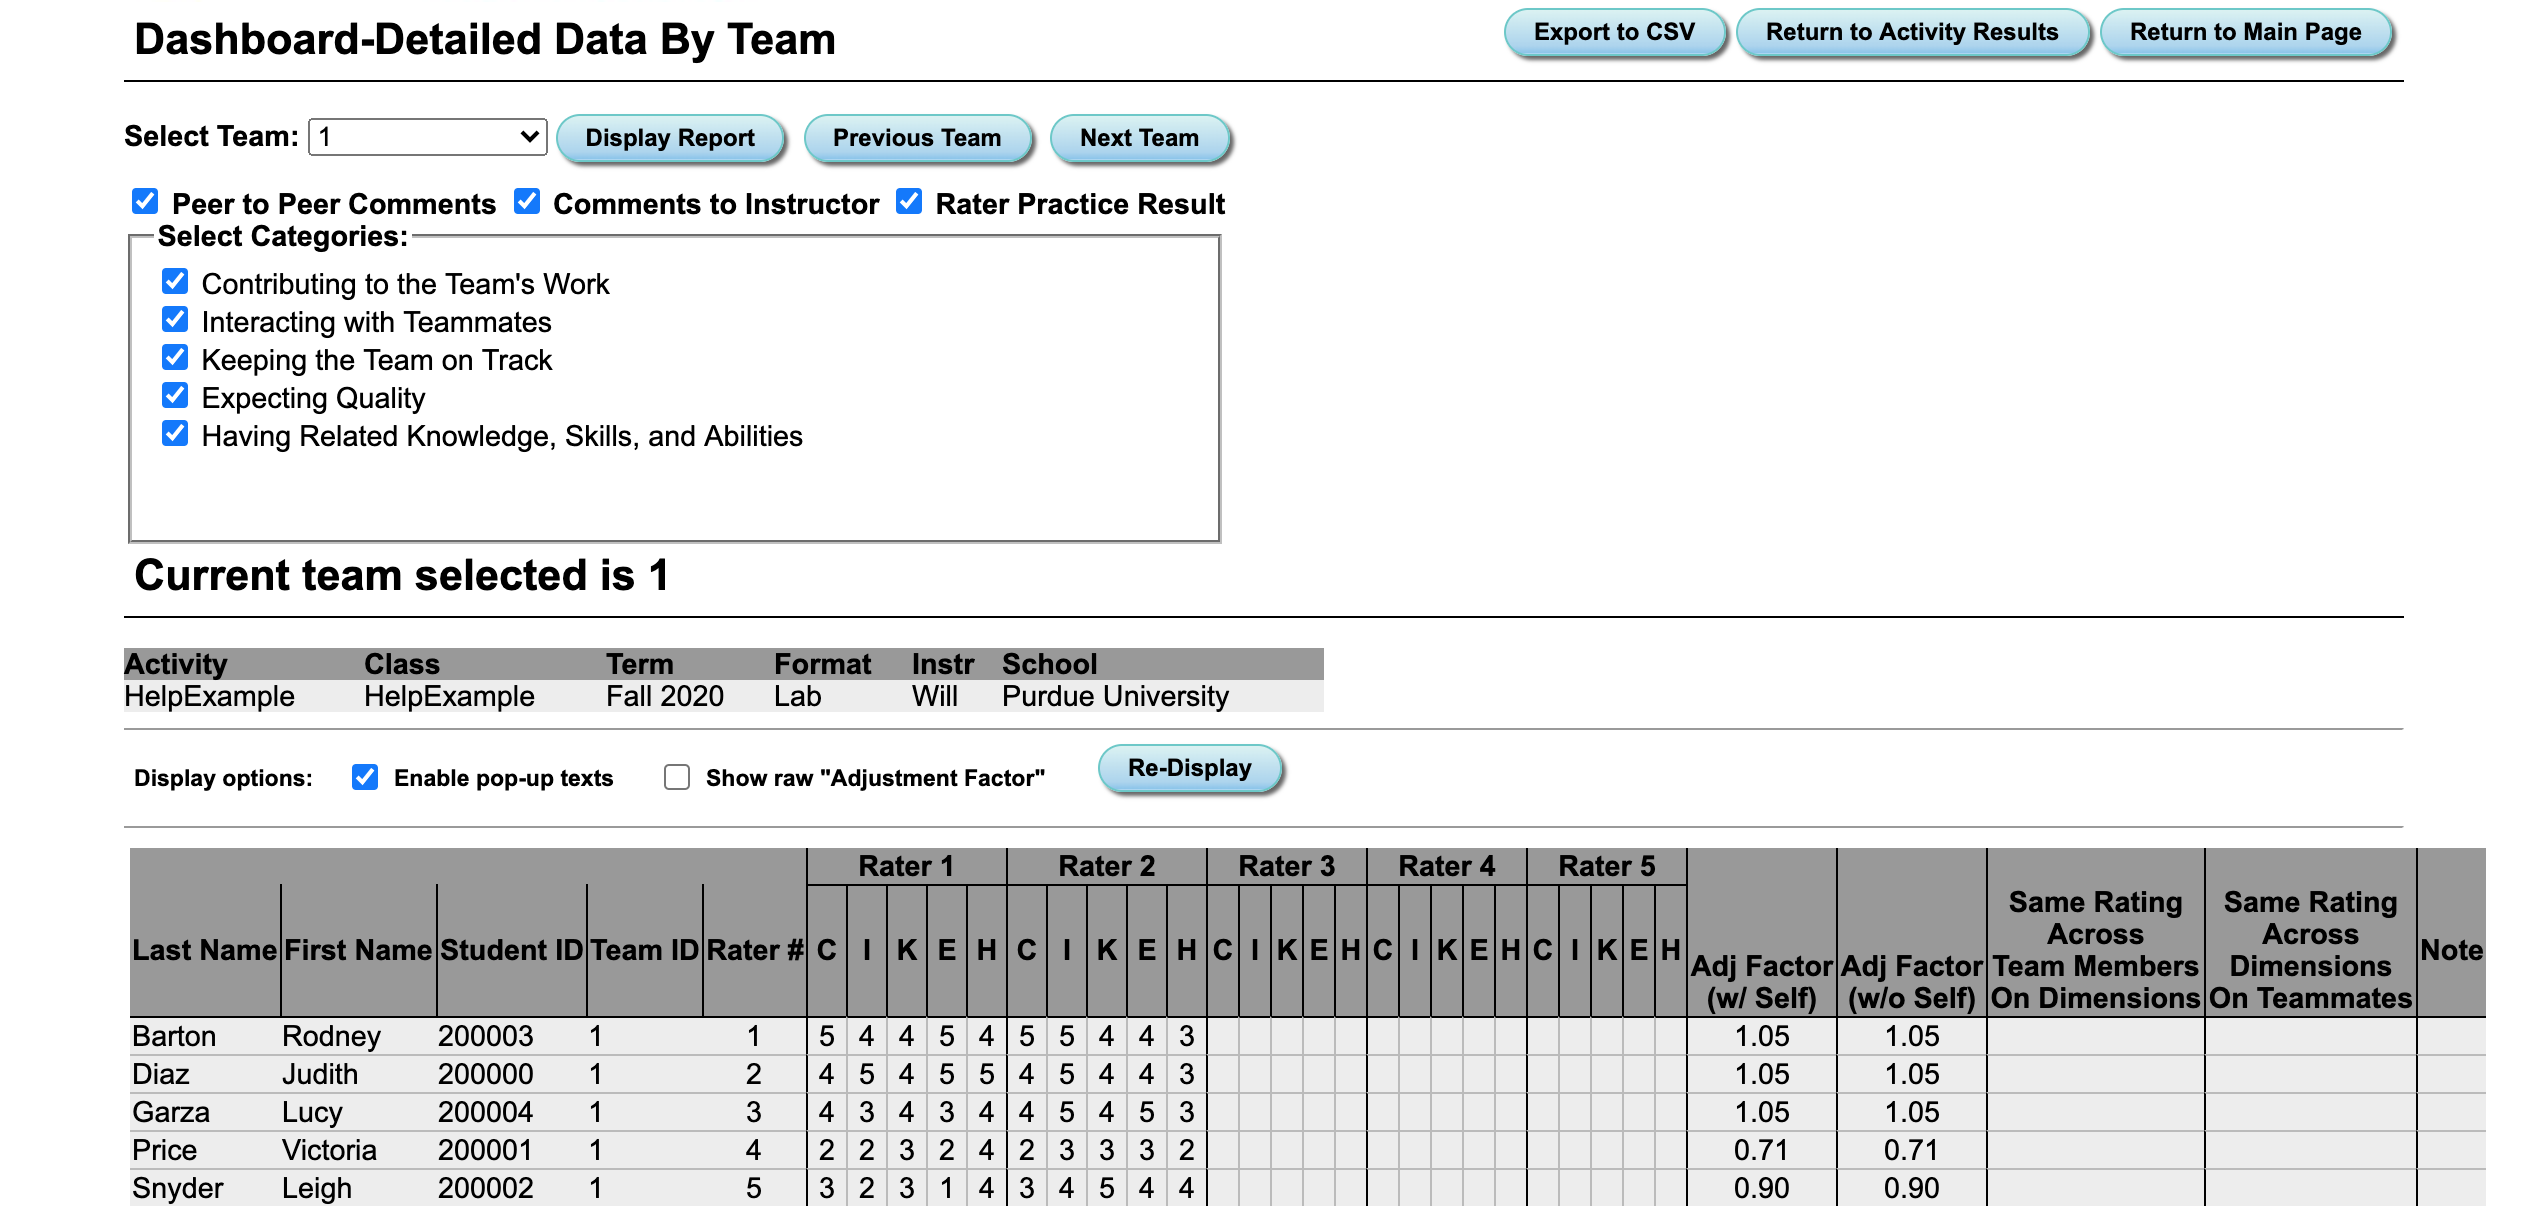
To export your data as a Comma Separated Value file that can be viewed in different spreadsheet editors, click the "Export to CSV" located in the top right corner of the page.

For more information on viewing data by teams, view the
Dashboard Detail by Team video.
Also visit the
FAQ for more information on viewing results.